More inventory, longer selling times, and what the latest numbers mean for buyers and sellers.
If you’ve been keeping an eye on the Montgomery Township real estate market, September’s numbers show some interesting changes compared to this time last year.
We’re seeing more homes available, longer selling times, and lower median sold prices in both the single-family and townhouse markets.
But does this mean home values are falling? Not necessarily. Let’s take a closer look.
Overall Montgomery Market Trends
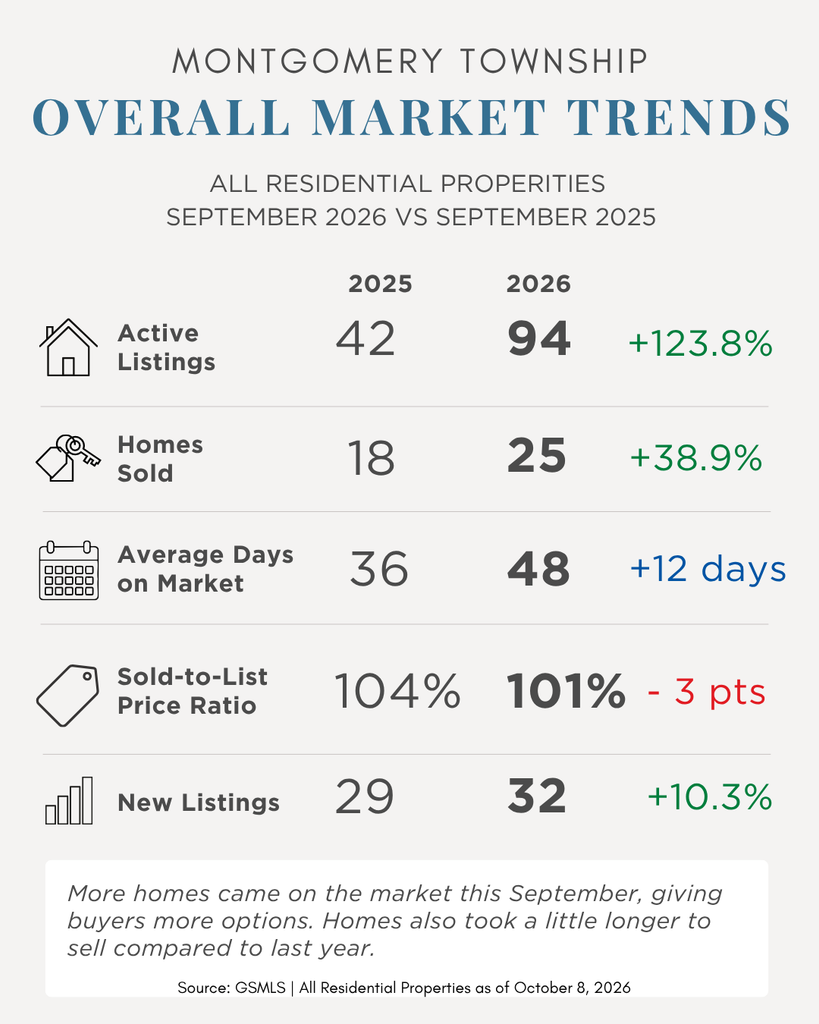
Looking at all residential properties, including detached homes and attached properties, here’s how September 2026 compared to September 2025:
| Market Activity | Sept. 2025 | Sept. 2026 |
|---|---|---|
| Active Listings | 42 | 94 |
| Homes Sold | 18 | 25 |
| Average Days on Market | 36 | 48 |
| Sold-to-List Price Ratio | 104% | 101% |
| New Listings | 29 | 32 |
One of the biggest changes is the increase in available inventory. Active listings more than doubled compared to last September.
For buyers, this means more homes to choose from and potentially less pressure to make an immediate decision.
For sellers, it means more competition. Pricing your home appropriately and making sure it shows well are becoming increasingly important.
Single-Family Detached Homes: What Sold?
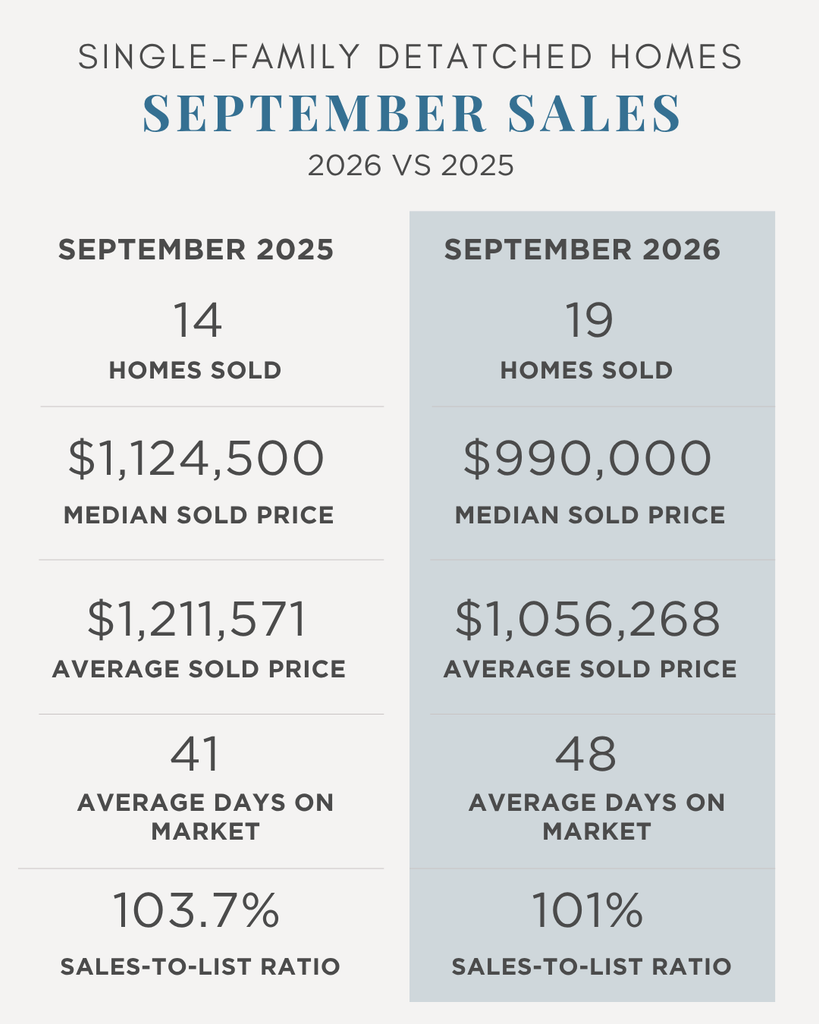
In September 2026, 19 detached homes sold in Montgomery Township, compared to 14 during the same month last year.
The median sold price was $990,000, compared to $1,124,500 in September 2025.
The average sold price was $1,056,268, and homes spent an average of 48 days on the market, compared to 41 days last year.
The sold-to-list price ratio also decreased from 103.7% to 101%.
While the median sold price declined approximately 12%, this doesn’t necessarily mean individual home values have fallen by that amount.
With a relatively small number of monthly sales, differences in the size, location, condition, and price range of homes sold can significantly influence the median.
Townhouse and Attached Home Sales
The townhouse market showed similar patterns.
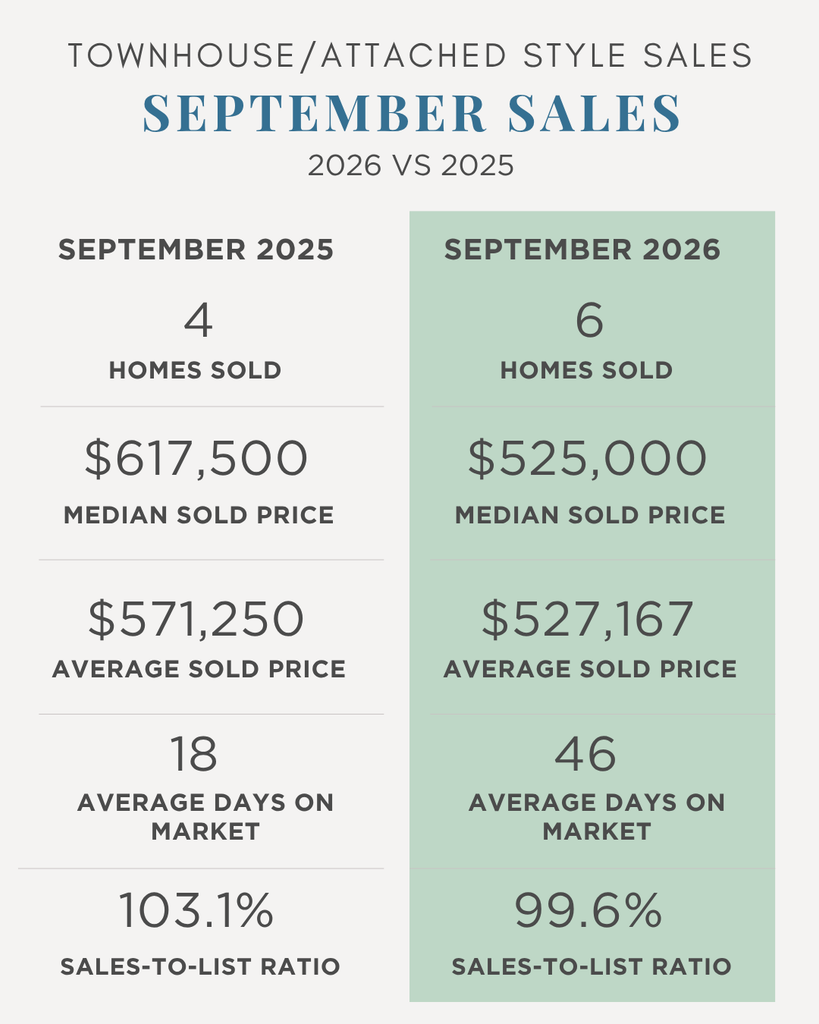
Six attached-style homes sold in September 2026, compared to four in September 2025.
The median sold price was $525,000, compared to $617,500 last year.
Average days on market increased from 18 to 46 days, while the sold-to-list price ratio decreased from 103.1% to 99.6%.
Because there were only six sales this September, it’s important not to interpret the lower median price as a direct measure of changing townhouse values.
What Does This Mean for Buyers and Sellers?
For buyers: There are more homes available than there were a year ago. With homes taking longer to sell, buyers may have more time to evaluate their options. However, desirable homes that are priced appropriately can still attract competition.
For sellers: The market is becoming more competitive. Buyers have more choices, and pricing based on last year’s peak sales without considering current competition could lead to longer selling times.
Presentation, condition, and a thoughtful pricing strategy continue to make a difference.
My Take on the Montgomery Market
What stands out to me most is that we’re seeing signs of a market that may be becoming more balanced.
More inventory and longer selling times are giving buyers some breathing room, but the average home is still selling at approximately 101% of its asking price.
That’s why it’s important to look beyond headlines about rising or falling prices and understand what’s happening with individual properties and neighborhoods.
Real estate is local, and even within Montgomery Township, market conditions can vary significantly by neighborhood, price range, and property type.
Thinking about buying or selling in Montgomery, Skillman, or Belle Mead?
I’d be happy to help you understand what these numbers mean for your specific situation.
Diana Andes | Realtor®
www.dianaandes.com
Source: GSMLS. September 2026 compared with September 2025. Data as of October 8, 2026. Overall market activity includes all residential property types; detached and townhouse sales are reported separately.